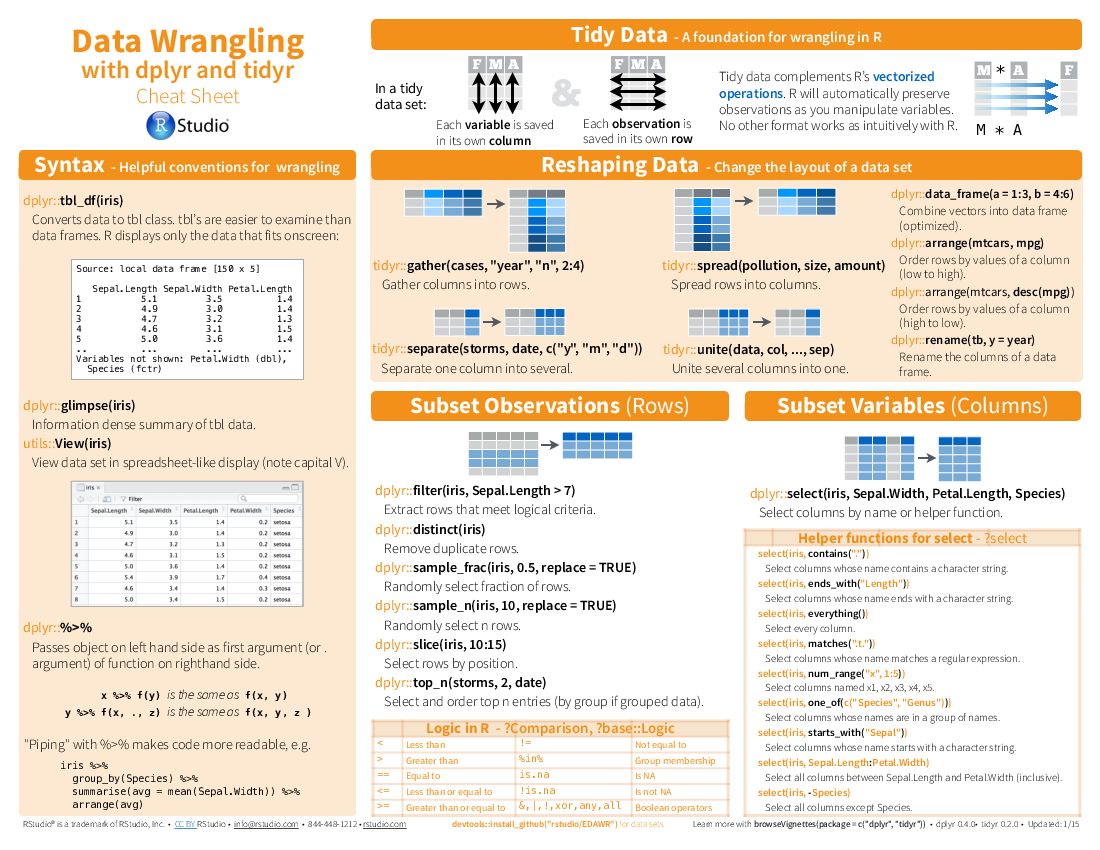
###Tidy data format I have came across the original tidyr paper recently, and start to understand more about tidy data format. In fact, in my previous post, the cheatsheet of dplyr also showed a the tidy data format. As Hadley Wickham pointed out in the paper, each observation should occupy one row, and each column should store the value of a variable.
library(dplyr)
library(tidyr)
## Warning: package 'tidyr' was built under R version 3.1.2
data(sleep)
This is a clean data, observation gathered to one column:
sleep # clean data
##    extra group ID
## 1    0.7     1  1
## 2   -1.6     1  2
## 3   -0.2     1  3
## 4   -1.2     1  4
## 5   -0.1     1  5
## 6    3.4     1  6
## 7    3.7     1  7
## 8    0.8     1  8
## 9    0.0     1  9
## 10   2.0     1 10
## 11   1.9     2  1
## 12   0.8     2  2
## 13   1.1     2  3
## 14   0.1     2  4
## 15  -0.1     2  5
## 16   4.4     2  6
## 17   5.5     2  7
## 18   1.6     2  8
## 19   4.6     2  9
## 20   3.4     2 10
This is a messy data with observations in two columns:
sleep %>%
	spread(group,extra) # messy data
##    ID    1    2
## 1   1  0.7  1.9
## 2   2 -1.6  0.8
## 3   3 -0.2  1.1
## 4   4 -1.2  0.1
## 5   5 -0.1 -0.1
## 6   6  3.4  4.4
## 7   7  3.7  5.5
## 8   8  0.8  1.6
## 9   9  0.0  4.6
## 10 10  2.0  3.4
###Situation that tidy data may not work I found this format very useful in analysis, especially when using dplyr and ggplot in my research. However, I have encountered one particular situation that tidy data may not be the best choice, which is machine learning. Since predictive models in R requires each row representing a sample or class label, and each columns contain observation or contributors, models can not be applied tidy data format. But as I am still new to the field, maybe there’s a way to get around or I misunderstood the table.
