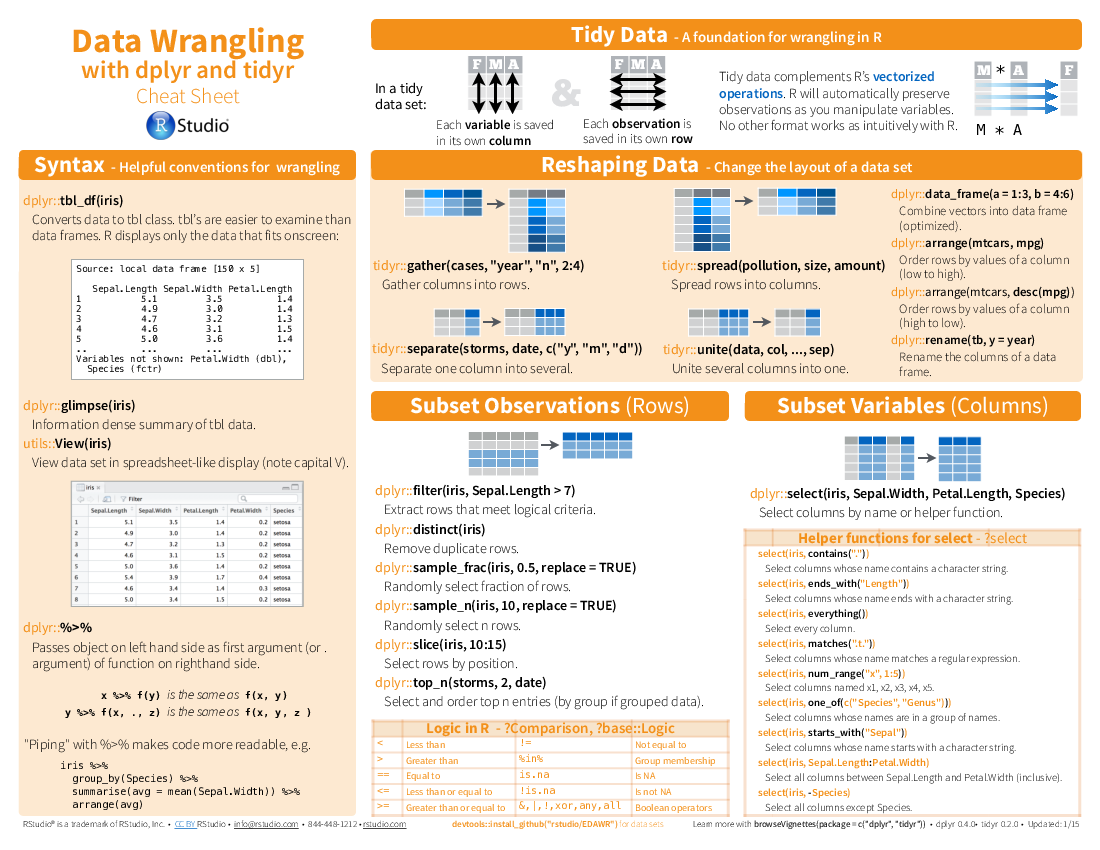
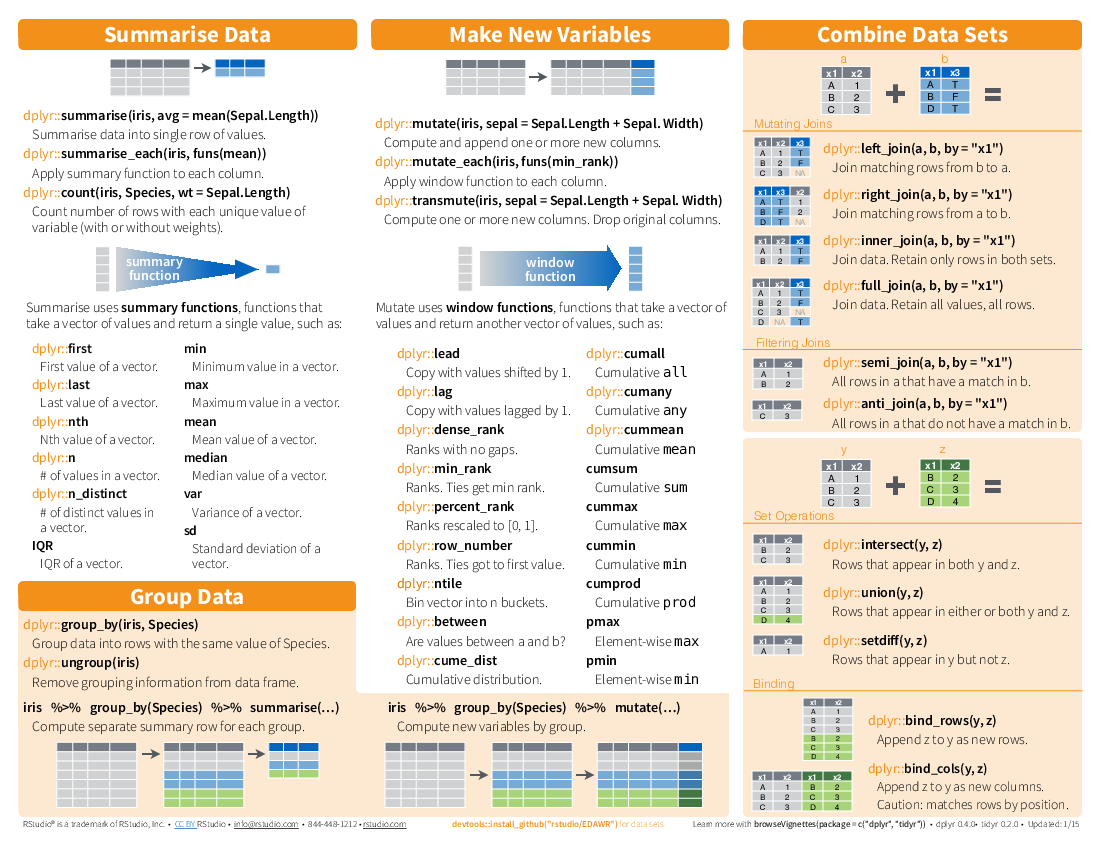
I have been using dplyr for a while and found it changing my codes in R scripts. It is very convenient as for data mungling and cleaning (whatever the verb you wish to use). The main syntax ‘%>%’ is almost like | in linux, any data frame can be passed/piped into the next verb.
library(dplyr)
## Warning: package 'dplyr' was built under R version 3.1.2
##
## Attaching package: 'dplyr'
##
## The following object is masked from 'package:stats':
##
##     filter
##
## The following objects are masked from 'package:base':
##
##     intersect, setdiff, setequal, union
data(DNase)

head(DNase)
##   Run       conc density
## 1   1 0.04882812   0.017
## 2   1 0.04882812   0.018
## 3   1 0.19531250   0.121
## 4   1 0.19531250   0.124
## 5   1 0.39062500   0.206
## 6   1 0.39062500   0.215
summary(DNase)
##       Run          conc             density
##  10     :16   Min.   : 0.04883   Min.   :0.0110
##  11     :16   1st Qu.: 0.34180   1st Qu.:0.1978
##  9      :16   Median : 1.17188   Median :0.5265
##  1      :16   Mean   : 3.10669   Mean   :0.7192
##  4      :16   3rd Qu.: 3.90625   3rd Qu.:1.1705
##  8      :16   Max.   :12.50000   Max.   :2.0030
##  (Other):80
dat <- DNase %>%
	filter(Run != 10) %>%   # filtering any Run smaller than 10
  	tbl_df()

summary(dat)
##       Run          conc             density
##  11     :16   Min.   : 0.04883   Min.   :0.0110
##  9      :16   1st Qu.: 0.34180   1st Qu.:0.1978
##  1      :16   Median : 1.17188   Median :0.5265
##  4      :16   Mean   : 3.10669   Mean   :0.7190
##  8      :16   3rd Qu.: 3.90625   3rd Qu.:1.1705
##  5      :16   Max.   :12.50000   Max.   :2.0030
##  (Other):64
dat <- DNase %>%
	mutate(Run_duplicate = Run) # make a new column with the verb 'mutate'

head(dat)
##   Run       conc density Run_duplicate
## 1   1 0.04882812   0.017             1
## 2   1 0.04882812   0.018             1
## 3   1 0.19531250   0.121             1
## 4   1 0.19531250   0.124             1
## 5   1 0.39062500   0.206             1
## 6   1 0.39062500   0.215             1
summaryTable <- dat %>%
              group_by(Run) %>%
              summarize(number_of_sample = n(),        # group_by and summarize can be very useful for
                        sum_density = sum(density))    # getting summary statistics for different categories

summaryTable
## Source: local data frame [11 x 3]
##
##    Run number_of_sample sum_density
## 1   10               16      11.530
## 2   11               16      11.358
## 3    9               16      11.294
## 4    1               16      10.833
## 5    4               16      10.890
## 6    8               16      11.292
## 7    5               16      11.274
## 8    7               16      11.728
## 9    6               16      11.937
## 10   2               16      12.044
## 11   3               16      12.392
from Rstudio blog